What the numbers mean
If you sort every Swiss postcode by average household size, the top of the list looks strange. 6684 Campo (Vallemaggia) leads with an average of 2.2 people per household. Sounds like a family haven, right? Except that figure comes from exactly 15 households. 3996 Binn hits 2.13, but spread across just 70 households. These aren't family hubs; they're tiny mountain villages where a single multi-generational farm can heavily skew the average.

Family by Edwina Sandys.JPG.Filter out the noise by requiring a decent baseline of households, and a much more realistic picture emerges. Look at places like 1653 Châtel-sur-Montsalvens, 4442 Diepflingen, 4955 Gondiswil, 4116 Metzerlen, and 1464 Chavannes-le-Chêne. They all sit at a solid 2.11 average, but they back it up with hundreds of households. The signal here is much harder to ignore.
The real family hubs are larger
The places that absorb the bulk of families aren't the remote outliers. They are the larger, agglomeration-style postcodes where thousands of households tell the same story.
Take 1212 Grand-Lancy with over 16,000 households, or 8953 Dietikon with more than 13,500. Then there's 8180 Bülach, 8280 Kreuzlingen, 1260 Nyon, and 4125 Riehen, all clearing the 10,000 household mark.

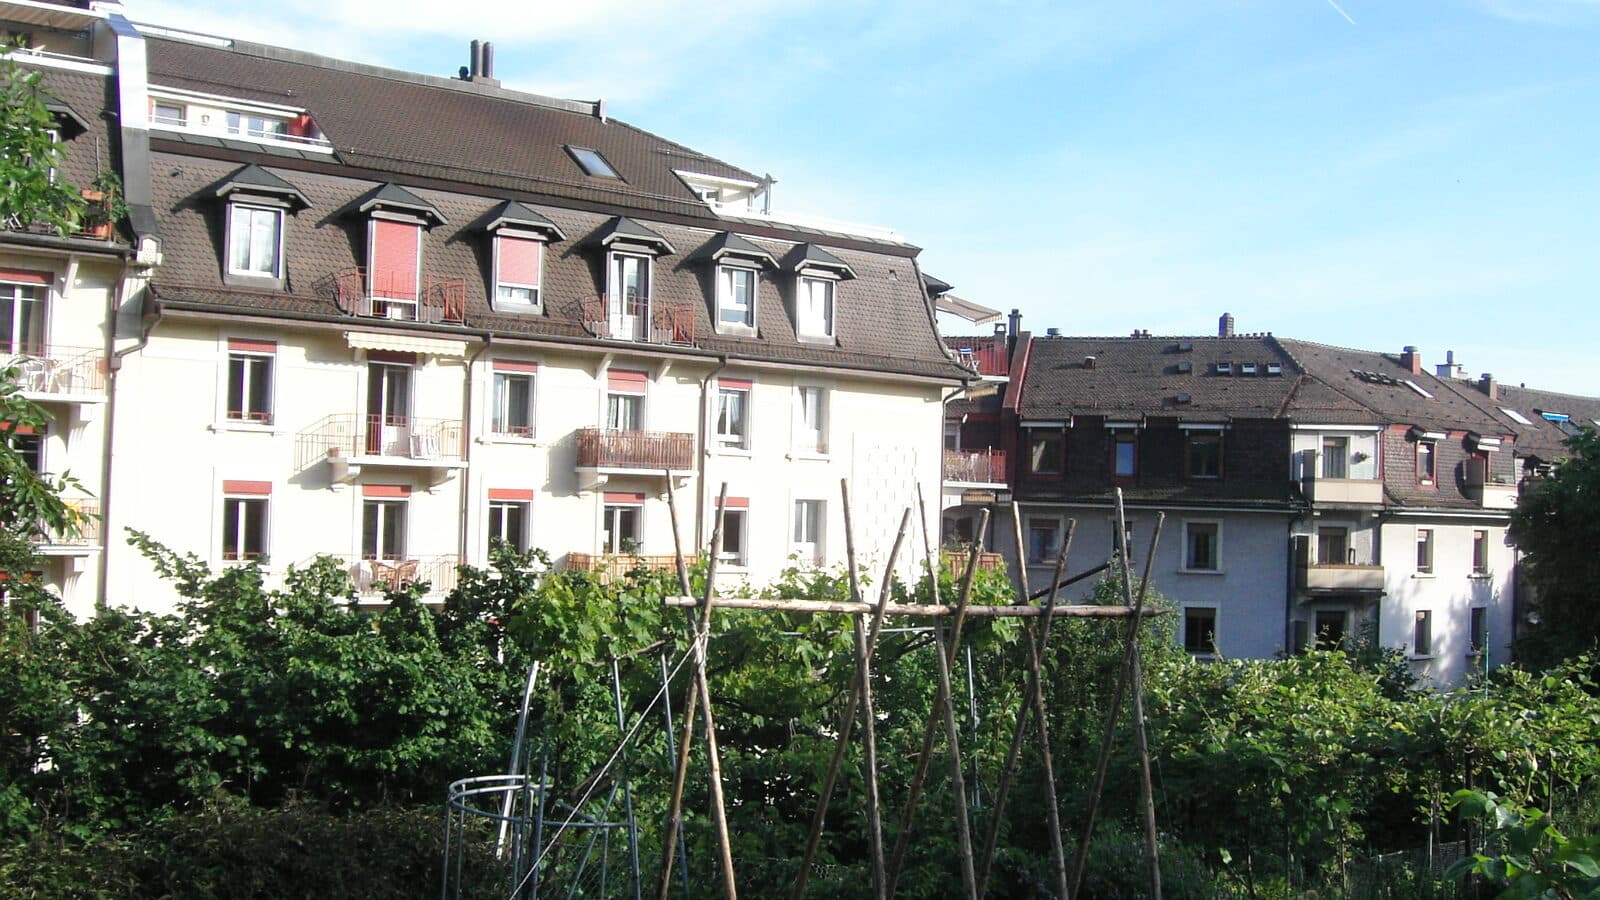
Apartment buildings at Avenue Beauregard, Lausanne.jpg.Their average household size hovers around 2.1. They don't win the raw statistical ranking, but they offer something much more valuable: scale. A demographic signal drawn from ten thousand homes tells you infinitely more about a neighborhood's everyday reality than a statistical quirk from fifteen houses.
Read the fine print
A high average household size is a good starting point, but it's not the whole story. Before you declare a postcode perfect for your family, look deeper.
Is the sample size reliable? Does the local housing stock match what you need? And crucially, how does the local tax rate treat families? 4442 Diepflingen ticks the demographic boxes and pairs it with a low family tax rate of 11.0%. Compare that to 4955 Gondiswil: the household stats look similar, but the family tax rate jumps to 15.7%. The demographic data gets you on the right track, but the financial reality is what seals the deal.